How to Debug Liquid Render Performance with Shopify Theme Inspector for Chrome
We all know that page speed performance directly impacts a buyer’s experience and the likelihood that they will make a purchase. Slow Liquid templates impact server response times, which then increases the time it takes for a page to start rendering.
The Shopify Theme Inspector for Chrome exposes detailed visual information on Liquid render performance, so you can pinpoint the specific lines of code that are slowing down your page. Once you have that information, you can fix the problem, make your client’s store faster, and convert more visitors.
In this post, you will learn how to get started with the Shopify Theme Inspector for Chrome, and how to use it to pinpoint inefficient Liquid code.
The source of slow render times
Sometimes adding many collections to one page or doing complex operations in a loop has adverse effects on Liquid render time. In general, simplifying template logic and restructuring the code can improve Liquid performance.
An example of what might be causing your Liquid to slow down is looping over product collections multiple times and executing expensive operations over and over:
{%- for product in collection.products -%}
 {% assign products_by_price = collection.products | sort: "price" %}

 // some liquid code
{%- endfor -%}
In the example above, we are looping through the products in the collection and creating a list of those products with each iteration. The value of products_by_price never changes, resulting in unnecessary repetitive computation.
Instead, we could simplify the code to only generate products_by_price once:
{% assign products_by_price = collection.products | sort: "price" %}

{%- for product in collection.products -%}
     // some liquid code
{%- endfor -%}
Now, the sorting of the prices happens only once and can still be accessed within the loop when needed.
Finding inefficiencies like the example above is like finding a needle in a haystack, but optimizations like these can really pay off and drastically reduce server response times.
So how do you actually find out where your Liquid is slow? This is where Shopify Theme Inspector for Chrome comes to the rescue.
You might also like: Announcing Shopify Liquid Code Examples for Partners.
Getting started with the Shopify Theme Inspector for Chrome
Shopify Theme Inspector for Chrome visualizes Liquid render profiling data, which gives you the means to triage the slowest parts of your Liquid templates. Visit the Chrome Web Store to install it in your browser.
Install Shopify Theme Inspector
Once the inspector is installed, navigate to your Shopify store. You will see a green Shopify logo in the extensions panel, located in the top right corner of your browser:

Before proceeding, make sure that your Shopify account has access to the store you want to profile by visiting your account page and logging into the store manager by selecting Your store.
Click the icon to open the extension popup and click Sign in. This will prompt you to log in to your store using your Shopify account.
Note: The Shopify Theme Inspector currently will not work with collaborator accounts.
Once you are authenticated, open the Chrome developer’s console (⌘ + ⇧ + C on Mac or CTRL + SHIFT + J for Windows) and select the Shopify tab. If the tab is not visible, check for it in the overflow list by selecting >>.
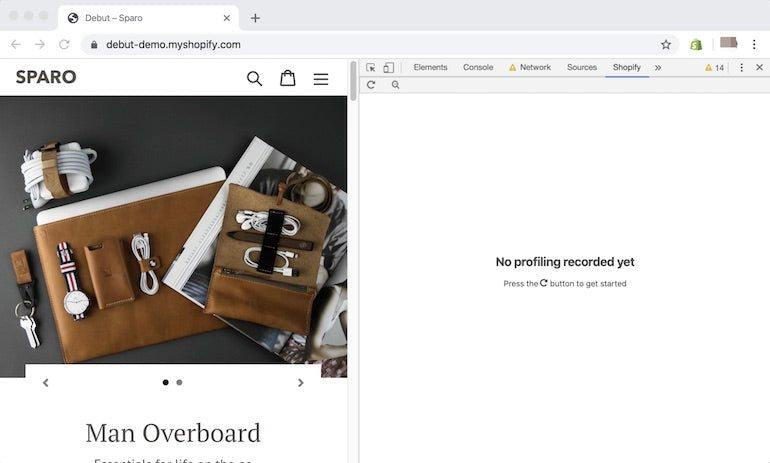
Once loaded, you will see a flame graph summarizing the timing of each node of Liquid used to generate the page. To learn more about reading flame graphs, check out this helpful guide.
See how the flame graph shows the timing of each node of Liquid in the video below.
You can click on the individual flame graph nodes to see detailed information about a specific node, like what file it’s contained in and what line it starts at. Each node in the graph shows the total time, i.e., the time it takes for itself and that of its child nodes.
You might also like: How to Create a Customizable Announcement Bar Section in Shopify.
Pinpointing Liquid performance bottlenecks
Continuing with our example from above, let’s use Shopify Theme Inspector for Chrome to debug the original page and find out where the problematic code is:
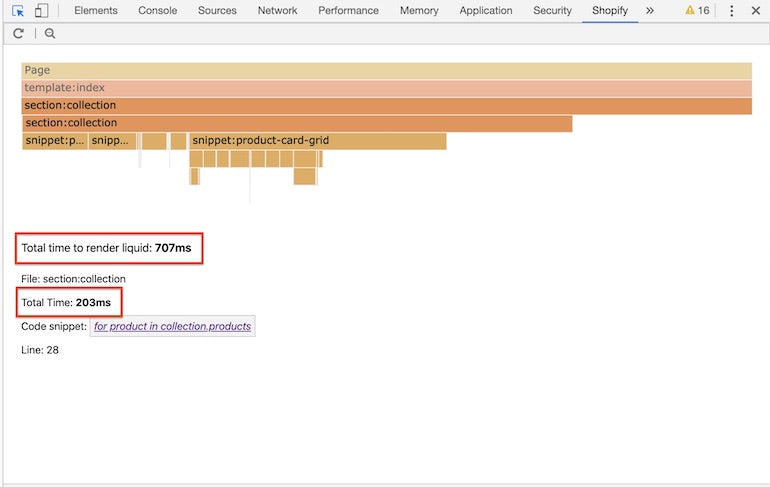
By clicking on the nodes with relatively large widths, we find that section:collection is contributing the most to the total page render time.
Below the flame graph, you will see details about the node that is currently selected. Click on the Code snippet link to view the Liquid file in your admin code editor. From there, you can continue digging into the problem and pinpoint the problematic code.
After making the changes we previously mentioned, we can reload the profile to inspect the change in render performance:
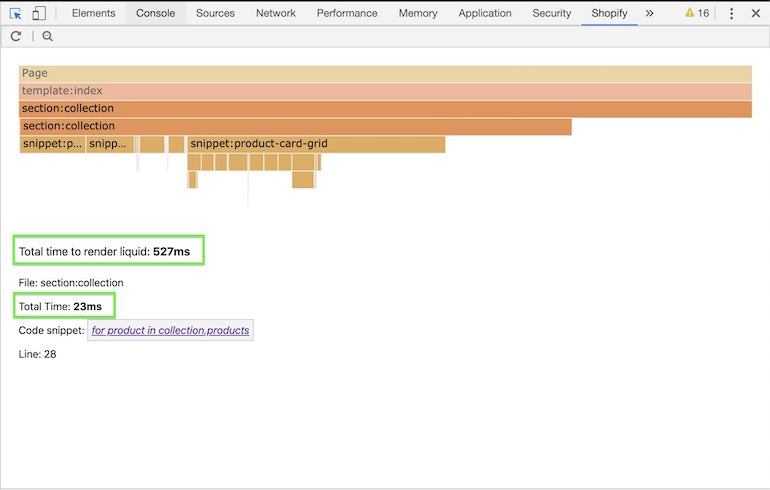
Inspecting the times, we can now see substantial savings.
Please note that it is normal to see variability in render times from profile to profile. This is due to external factors on Shopify servers.
You might also like: How Lazy Loading can Optimize Your Shopify Theme Images.
Speed up your clients’ stores
The Shopify Theme Inspector for Chrome puts a spotlight on poor Liquid performance. Using this tool, you can take your clients’ stores’ performance into your own hands and make a change for the better. Install the Shopify Theme Inspector for Chrome today and start converting more of your client’s visitors to buyers.